13 publications found
An Investigation on the Economical Profitability of Increasing a Ship Structure of Overaged Small Inland Navigation Vessels
Inland waterway vessels are considered the cleanest land based transport mode in terms of its CO2 emissions on a per ton-km basis. However other modes are quickly catching up and speeding up is needed to maintain the IWT green character. For some
emission categories (NOx, PM), road transport is already outperforming IWT. One reason for IWT to lag behind other modes is the long technical and economic lifetime of ships, which can easily extend 50 years. The replacement rate of the fleet is therefore
rather low. This means, by modernising just through replacing older vessels by newer ones, the sector may become bypassed by other transport sectors soon. Therefore, action is needed targeting the existing IW fleet. To improve the performance of the
inland waterway sector especially the existing fleet should be modernized. Currently there is insufficient knowledge about how to modernize the inland waterway fleet efficiently.The MoVe IT! project aims to develop concrete applications that can be installed on existing ships. WP 6 focuses on the most common old vessels in the fleet. WP6 can be split in two clusters. The first cluster analyses the options to improve the competitive
position of relatively small vessels in the fleet (CEMT II and III) by lengthening them (with a goal to reach CEMT IV). The second cluster assesses new market opportunities for single hull tankers. This report is the last step of the first cluster where the economic
and environmental feasibility of the lengthening steps are assessed.Lengthening of small inland vessels (by contemporary standards) is found to be economically feasible. It seems that vessels that fall within the CEMT II and III class can benefit of this retrofit option, as is shown from the business cases for the MV Hendrik
and the MV Rheinland conducted in this task. Based on the analysis done and also in line with the results of the lengthening done in WP 7.2, inland vessels already need to have a critical mass to ensure that the lengthening will be economically feasible. If a
vessel is too small, as is the case for e.g. the MV Rheinland, lengthening will be less feasible, especially when the vessel is only lengthened with 6 metres. To make lengthening a feasible option the benefits need to outweigh the investment costs.From an economic and environmental perspective it seems feasible to install a propeller in nozzle instead of a naked propeller. The propeller in nozzle is able to reduce the fuel consumption and therefore the impact of CO2 emissions. To have full economical and environmental effects, the speed should be reduced, but speed reduction has a cost too and is not as easy as it sounds.
An Investigation on the Possibility of Increasing Ship Structures of Overaged Small Inland Navigation Vessels
This deliverable 6.1 “Ship Structure” presents the investigations on the lengthening possibilities of two existing inland navigation vessels for dry bulk cargo, MV “Hendrik” (LOA 70.0 m) and MV “Rheinland” (LOA 57.5 m), representing a share of the European fleet in need of retrofitting and modernisation in order to regain competitiveness on the market. Among other retrofitting procedures such as increasing the breadth of the hull or conversion for different types of purposes, lengthening the ship’s hull in the midship area by a prismatic section is the most effective and cost efficient way.
MV “Hendrik”, originally built in 1975, represents CEMT class III to IV (Conférence Européenne des Ministres de Transport) for inland navigation vessels and features a double bottom and single side platings. CEMT class II is represented by MV
“Rheinland”, built in 1959, which is equipped with a single hull. Both vessels comprise transversally framed ordinary mild steel structures. Those two vessels serve as basis for exemplary investigation on the lengthening of the ship’s hull and its required strength.
After the determination of current plate thicknesses and stiffener dimensions according to GL (Germanischer Lloyd) rules for MV “Hendrik” and BV (Bureau Veritas) rules for MV “Rheinland” and comparison with the “as built” dimensions from the general arrangement drawings, investigations were made in order to define the maximum
possible lengthening sections. Hence, each step was set to 6.0 m. The maximum lengthening sections turned out to be 18.0 m for MV “Hendrik” and 12.0 m for MV “Rheinland” which were limited by the thicknesses of existing plates. Additionally, some stiffeners had to be modified to comply with the current rules.
For economic purposes, initial estimations regarding the cargo benefit and draught reduction per lengthening meter were made as well as an approximate cost calculation for the retrofitting procedures.
The results will serve as input for all other tasks within WP 6 and additionally WP 7.Analysis to Establish the Practical Limits of Ship Size to Which it Stil Can be Propelled Effectively.
Main objective of this analysis is to establish the practical limits of ship size that can still be propelled effectively. For that purposes two typical single-propeller IWW ships were chosen – MV “Hendrik” and MV “Rheinland”. Through the analysis draught and breadth of the ships were kept constant, while different ships lengths were considered (virtual lengthening was performed within Task 6.1). Although the increase of ship length leads to the increase of ship displacement and therefore to increase of propeller loading for the same ship speed, the propeller diameter could not be changed due to limited space.
Virtual repowering was done for both vessels. Contemporary high-speed Diesel engines were considered for retrofitting (derived from general application engines applied in the road vehicles that satisfy all present requirements concerning emissions etc.) as these are more efficient, cleaner, cheaper (for maintenance too) and lighter than conventional ship engines. More advanced propulsors (then Diesel engines, conventional propellers etc.) suppose to be investigated within other MoveIt WP, as for instance WP2 – Hydrodynamic improvements, WP4 – Power etc., WP6, in general, deals with mature and proven technologies.
Amongst the lessons learned within Task 6.3, it was concluded, that the power needed for achieving certain speed is not significantly influenced by lengthening, so the same power train (engine/gearbox/propeller) was considered for all lengthening steps. Water depth, however, is the main factor that influences power.
Also, original naked propeller was replaced with a propeller in nozzle as these are considered to be more effective for IWW shallow draught vessels.
An Investigation at Establishing the Effects of Lengthening Inland Vessels on the Manoeuvrability, Including Shallow Water Effects.
This task aims at establishing the effect of lengthening inland vessels on the manoeuvrability, including shallow water effects.
To determine the manoeuvring characteristics, standard zig-zag, combined turning circle / pull-out, evasive manoeuvres and crash stop simulations were conducted, considering the lengthening of typical inland vessels as reference (Hendrik and Rheinland), at different water depths and approach speeds.
The simulations were performed with SurSim, this is a program which simulates manoeuvring in the time domain. The typical output is a time trace of positions, angles, propulsion and rudder data. Based on the results of these simulations, trend of the effect of lengthening the inland vessels on the manoeuvrability, including shallow water effects, are depicted.
Based on the manoeuvring simulations, it could be concluded that the manoeuvring performances in terms of turning ability, directional stability, yaw checking ability, initial turning ability and stopping ability are not drastically affected by the lengthening of the vessel and therefore no practical measures should be needed. In the evasive manoeuvre simulations, the manoeuvring performances for Hendrik vessel are affected by the combination of lengthening of the vessel and shallow water effects: improvements on the rudder dimensions and characteristics can probably solve this issue.
Analysis and Developments of Retrofitting Consequences to Structures and Weight Using New Material and Structures
This document covers the analyses and developments of task 5.2 “Retrofitting consequences” within work package 5 “Structures & weight” relating to retrofitting solutions for actual single hull inland navigation tankers into double hull vessels and alternative solutions for the lengthening of inland navigation vessels. Innovative designs using lightweight structures and new materials such as composites are considered in order to assess their capabilities and benefits.
Two vessels are considered for the investigations:
• Single hull inland navigation tanker: MV “Internautic I“ with a length over all of 80.0 m and a cargo capacity of 1980 t at a draught of 3.63 m.
• Double hull multi-purpose cargo vessel: MV “HERSO I” with a length over all of 84.95 m and a cargo capacity of 1381.5 t at a draught of 2.70 m.In order to meet the upcoming ADN regulations for the carriage of dangerous goods in 2018 where only vessels equipped with a double hull are permitted, various alternative double hull designs are investigated towards their feasibility as retrofit solution, namely:
• Steel/polymer-foam/steel double side structure
• λ-shape alternative steel structure
• Rubber bags with supporting structureFor the lengthening investigations the following composite variants are considered:
• Solid glass fibre reinforced polymer section
• Glass fibre reinforced polymer sandwich section
• Solid carbon fibre reinforced polymer section
• Carbon fibre reinforced polymer sandwich sectionThese innovative solutions are compared to the mandatory base steel double hull, complying with the current classification rules of Germanischer Lloyd and ADN requirements if applicable, to reveal benefits and drawbacks using computer aided design (CAD) tools and finite element analyses (FEA). A risk assessment completes the evaluation of the novel technologies.
Related documents are D 5.3 “Crashworthiness”, in which the capabilities in terms of side impact and grounding are presented, D 5.4 “Production”, where the economic assessment is conducted, and D 6.1 “Structures” as well as D 7.1 “System integration”, where ships are lengthened by conventional methods.
Hydrodynamic Improvements by the Use of CFD Calculations on Existing Inland Waterway Transport Vessels
The goal of the EU project MoVe IT! is to develop a suite of options for the modernisation of inland ships that meet the challenges of over-aging of the fleet, climate change and stronger environmental objectives and provides decision support regarding the application of these options.
In WP1 the state of the art is defined by means of a literature study and by means of full scale measurements on board of five inland vessels. The goal of the measurements is to determine the performance of existing vessels in a controlled environment. Measurements have been done on board of five inland vessels and the performance of the selected vessels has been determined. For the vessels that perform below average CFD calculations have been performed within WP2 to determine the effect of retrofit measures. The results and analysis of the CFD calculations are presented in this report.
From the CFD calculation results a reduction in power due the retrofit measure will be retrieved. This is input for WP7 system integration and assessment.The measurement results performed in WP1 showed that all vessels, except for the Veerhaven X pushboat were performing below average. For all vessels performing below average CFD calculation have been performed to investigate retrofit measures.
Each case had different aspects had to be investigated, therefore for each case a computation program was selected most suitable for investigating the retrofit measure. Since CFD calculations are a simulation of reality some simplification have to be taken into account. In the section of the CFD analysis of each vessel is written what simplification have been made to perform the calculations.
This report is divided into 4 Sections. In Sections 1 thru 4 the CFD calculation analysis of respectively Carpe Diem, Herso-I, Inflexible and Dunaføldvar are shown. Finally an overview of all the conclusions is presented.
Ex-ante Cost/Benefit Analysis of Business Cases for Energy-Efficient Navigation
This PROMINENT report, Deliverable 2.4, presents the ex-ante cost/benefit analyses for energy efficient navigation. The major goal of energy-efficient navigation is to reduce the fuel consumption of a vessel while preserving or even improving the service quality of transportation. This shall result in cost savings for the ship owner/operator, as well as a reduction of climate emissions (CO2) and air-pollutant emissions such as NOx and PM. Fuel savings are expected to result from sailing at the optimal location in the fairway (causing the least resistance), as well as by means of optimising the sailing speed based on the actual conditions of the waterway.
This report presents the costs and benefits from the viewpoint of the shipowner/operator. The economic advantage for the ship owner/operator is a decisive element for the roll-out potential of energy-efficient navigation.
The work started with desk research on various costs estimations and impacts of energy-efficient navigation (notably fuel savings), based on a great number of programmes and research projects. The main sources consulted were COVADEM, MoVe IT!, IRIS EUROPE 3, NEWADA Duo, Voortvarend besparen, Econaut, Topofahrt, CREATING and The Cleanest Ship, describing different systems and tools, as well as test results derived with relevance to energy-efficient navigation.
This desk research provided however an unclear and scattered view on the costs and the estimated fuel savings. There is a large bandwidth in the cost, as well as the fuel-saving estimations. This wide uncertainty shows the need for the pilot activity to be carried out in PROMINENT, as a clear view is needed on the economic value of energy efficient navigation, taking into account differentiated costs and benefits for different types of waterways and vessels. In order to be able to calculate the costs and benefits, a scenario approach was used. The following tables present the bandwidth of values for the costs of the on-board unit and equipment, as well as the fuel consumption assumed. It is noted that the results presented are supposed to be of the correct order of magnitude. Deviations are expected, becoming clearer once the results of the pilots are known.
Costs of on-board unit and equipment Low Medium High Ordinary echo-sounder:
10,000 EUR
(COVADEM approach)Advanced echo-sounder: 40,000 EUR
(NAVROM pilot)Sophisticated ADCP (or GNSS GPS) and advanced echo-sounder:
80,000 EURO
(BAW – NEWADA DUO)Table 30: Bandwidth in costs relating to the on-board unit and equipment.
Fuel consumption savings Low Medium High 3% 14% 25% Table 31: Bandwidth in fuel-consumption savings.
Three scenarios have been defined:
Pessimistic scenario Base-case scenario Optimistic Investment in on-board unit and equipment 80,000 EUR 40,000 EUR 10,000 EUR Fuel saving 3% 14% 25% Table 32: Scenario characteristics.
Moreover, the time for installation of the hardware and equipment was assumed at 1 day with an average value of 2000 Euro. In addition, an annual cost of 3000 EUR was taken into account to cover variable costs for communication, maintenance, training etc.
Since the effect to be expected is a reduction of fuel consumption, the economic saving is very much dependent on the fuel price. Since the fuel price is volatile, a sensitivity analyses was carried out also for the fuel price with the following values:
Fuel price per 100 litre Low Medium High 23.65 EUR
(February 2004)49.25 EUR per 100 litre (monthly average in period January 2004 – September 2015) 67.81 EUR
(July 2008)Table 33: Fuel price settings for sensitivity analyses.
The results of the calculations of the costs and benefits show that the business case is very much depending on the total fuel consumption of the vessel. The costs and benefits were calculated for the fleet families and for the representative journeys (defined in PROMINENT WP1.1), taking into account the estimations on their annual fuel consumptions.
Results base case
For the base case, the business case is positive from a fuel consumption of around 70 m3 per year in case of high fuel prices, around 100 m3 per year for average fuel prices and 250 m3 per year for low fuel prices. In case of very high fuel-consumption figures such as 1000 m3 per year, the total sum of the discounted saving (NPV) over a 15 year period can be 250,000 EUR at low fuel prices and up to 850,000 EUR at high fuel prices. Compared to an investment of 40,000 EUR, these benefits are quite remarkable. This means that each euro initial investment (40,000 EUR) will yield 21 times more money (850,000 EUR / 40,000 EUR) in case of high fuel prices over a 15 year time period and about 6 times more in case of low fuel prices (250,000 / 40,000 EUR).Since the 110 meter dry-cargo motor vessel is considered as the “working horse” for European inland waterway transport, the following graph shows the development of the cash flow after the 40,000 EUR investment at the average fuel price of 49.25 EUR per 100 litre. The result presented is based on an estimated annual fuel consumption of 311 m3 per year.
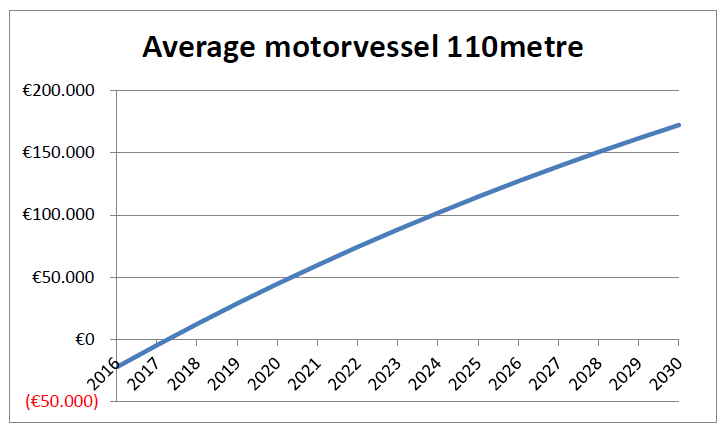
Figure 20: Development of Net Present Value (NPV) over time presented for the base-case scenario and the average fuel price considered for a 110 metre vessel. Note: e.g. 2016 means end of the year 2016.
It can be seen that after an initial investment taken in the first year (end of 2015), the benefits are providing a break-even situation already after 2.5 years. The Net Present Value for this time span is 172,000 EUR and the Internal Rate of Return is 41 %. This is quite significant and positive.
Results pessimistic scenario
The CBA calculations for the pessimistic scenario illustrate that only really large vessels such as 6-barge pushed convoys have some benefit in case of average or high fuel prices due to their high fuel consumption values. Assuming the average fuel price, a break-even situation is given for vessels with a yearly fuel consumption of 800 m3. However, it shall be reminded that the calculation takes into account the savings over a period of 15 years while the fuel price development is quite uncertain. Therefore, the risk to be taken as regards the fuel price development shall be incorporated in these investment decisions. The ship owner/operator will expect a higher Return on Investment (ROI). In general, the Internal Rate of Return shall be at least 4 %. For the pessimistic scenario, at the average fuel price a 4 % return rate is reached in case of 1000 m3 fuel consumed per year. However, in case of high fuel prices, a gain of 4 % would be reached already at 750 m3 fuel consumed per year.Results optimistic scenario
For the optimistic scenario, the Net Present Value (period 2016 – 2030) is positive already starting from an annual fuel consumption of around 50 m3. Already at this relatively low fuel consumption of 50 m3 per year the Internal Rate of Return accepts values of 12 % and 29 % at average and high fuel prices, respectively. This means that also for smaller vessels below 86 metres that operate on daily basis the business case can be positive.Ex-ante Cost/Benefit Analysis of Business Cases for Standard After-Treatment Configurations
This analysis shows as a first calculation of the costs and benefits of the application some figures about the economic feasibility of the application of after-treatment. As already concluded in Deliverable 1.2, with the application of SCR and DPF it is possible to achieve a major reduction of air pollutant emissions. However, this reduction comes with a price, as there are no benefits covering the entire costs of the application.
Annual costs SCR and SCR+DPF: Highly dependent on vessel type and engine type
In this analysis the annual costs were calculated for 22 different vessel types, these absolute costs are influenced by a number of factors, such as the fuel consumption, the number and size of the engines (in installed power), the power used in normal conditions and the engine hours. This results in annual costs of applying SCR of maximum around 30,000 euro for the regular motor cargo vessels with CCNR Stage-I engines, which mostly depends on the size of the vessel (e.g. for a 38.5 metre motor vessel, the annual costs amount € 4,521). At the other side, for the coupled convoys and especially the larger pushed convoys, these costs can range from around € 47,000 to around € 117,000. For vessels with CCNR Stage-II approved engines, the annual costs of applying SCR can be 5-22% lower than with CCNR Stage-I or non-type approved engines.For the application of SCR and DPF, the annual costs can be 45% to 91% higher for high-speed engines than the annual costs for the application of only SCR. Due to the higher investment costs for the filter, this is even higher for the medium-speed engines (between 64% and 129%). The annual costs can go up to € 219,000 for a pusher with 6 barges and medium-speed CCNR Stage-I engines, which is according to the report of D1.1 the most common engine used in this fleet family.
Relative cost increase of applying SCR and SCR+DPF compared to base line costs
There are major differences between vessel types and engine types in absolute annual costs for the application. To show the business case in relation with the general costs a ship-owning company has in operating a vessel, the relative cost increase of the application of SCR and SCR+DPF has also been calculated. For application of SCR this cost increase is on average around 2.4% (for CCNR Stage-II engines) and 2.8% (for CCNR Stage-I engines).For SCR+DPF this is on average around 3.9% (for CCNR Stage-II, high speed) to 4.9% (for CCNR Stage-I, medium speed). For some vessel types, like passenger vessels, this is even much lower (1.3% for applying SCR+DPF on a CCNR Stage-I high speed engine, the most common engine). The cost increase for the larger motor tank vessels is also relatively low, especially taking into account that many of these vessels have CCNR Stage-II engines. At the other side, for the Danube push boats with four barges, this can be around 6.3% for SCR-DPF on the most common engine (CCNR Stage-I high speed engine). In lesser extent, this counts also for the coupled convoys, the other push boats with high installed power, but also for some smaller vessel types (e.g. motor vessel 38.5m).
The same conclusions can be seen in the outcomes for the representative journeys. Because of the high relative costs for the Danube push boats, this is also relatively high for the Danube journeys. On the Rhine journeys most of the ship-owning companies can benefit from the discount on the port dues, which covers in the most positive situation (journey 13, motor vessel 110 m with containers, between Rotterdam and Duisburg) for 15% (SCR+DPF) and 24% (SCR-only) of the extra annual costs, resulting in a net annual cost increase of 2% (SCR+DPF) and 3.5% (SCR-only). For journey 9 (motor tank vessel, 135m, between Amsterdam and Rotterdam with oil) this cost increase is the lowest with respectively 1.7% and 3.1%.
Relative costs SCR and SCR+DPF per tonne cargo transported
Journey 9 of the Rhine journeys has also the most positive business case, if expressed as costs per tonne cargo transported, € 0.03 and € 0.05 for respectively SCR-only and SCR+DPF. Although the annual costs for applying it on a push boat, the costs per tonne cargo transported is also relatively low for journey 1 of the Rhine journeys (push boat Rotterdam-Duisburg). Due to the high payload carried, this is respectively € 0.07 and € 0.13. Although the discount on the port dues reduces the net annual costs of applying SCR and SCR+DPF for the Rhine journeys, there is not a big difference between the average costs per tonne cargo transported for the Rhine and Danube journeys. For the Danube journeys these costs are between € 0.07 and € 0.29 for SCR and between € 0.11 and € 0.44 for SCR+DPF. For the journeys on the other waterways these costs are higher (between € 0.23 and € 0.32 for SCR and between € 0.35 and € 0.48 for SCR+DPF), because of the low average payload.Relative costs SCR and SCR+DPF compared to environmental benefits
As SCR and DPF is effective in reducing NOx and PM emissions, making it possible to achieve emission levels proposed for new emission standards (EU NRMM Stage-V). For that reason, the choice have been made to express the annual costs of applying SCR and – in combination with – DPF as costs per kg NOx and PM reduction. This shows that although the annual costs of applying SCR on a CCNR Stage-I engine is higher than on a CCNR Stage-II engine, the costs per kg NOx-reduction are lower. For the CCNR Stage-I engines these costs range from € 1.12 (a Danube push boat with 4 barges) to € 5.04 (MVS 38.5m) and respectively € 1.68 to € 9.23 for the same vessel types with CCNR Stage-II engines. These costs are lower for some of the Rhine/ARA journeys, because of the discount on the port dues, ranging from € 0.99 to € 1.87 for SCR-only. For the Danube journeys these costs are between € 1.16 and € 1.41 per kg NOx reduction, for the journeys on the other waterways between € 1.44 and € 1.90 and relatively high for the passenger journeys (€ 2,97 and € 3.82).For the additional costs for applying a DPF on an SCR system, the costs are calculated per kg PM emissions. This ranges from € 33.36 (Danube push boat with 8/9 barges) to € 122.50 (MVS 38.5m) for high-speed engines and € 43.72 to € 177.43 for the same vessel types with medium-speed engines. The costs compared to the emission reduction are relatively high for the smaller motor cargo vessels (38.5m and 50m) and the push boats with 500-2,000kW installed power. The most positive case compared to the emission reduction is for the Danube push boats, the medium large motor cargo vessels (105m and 110m) and motor tank vessels (86m and 110m) and the passenger vessels.
Recommendation: Comparing costs per units of emission reduction with external cost reduction
Before drawing conclusions on the application of only SCR or also DPF based on the costs per kilogram NOx and PM emission, it is important to notice that one kilogram of NOx and one kilogram of PM are not equal in external costs. To get a good insight into the effects of SCR and SCR+DPF, the costs of SCR/SCR+DPF per kg NOx or PM reduction could be compared with the external costs of a kg NOx or PM. There are several methodologies for calculating the external costs of transport, for example Handbook on estimation of external costs in the transport sector (CE Delft et al., 2008) and its update for 2008 (CE Delft et al., 2011). Taking 2008 as base year the external costs per tonnes are given in Table 37 for the countries of the representative journeys.This shows that it is possible in many cases to achieve higher environmental benefits – measured in the reduction of external costs – than the costs for the application of SCR. Depending on the regular operating area mainly of the vessel (more densely populated regions or non-urban regions), this is also possible in some cases for the application DPF. Thus implying that the measure could be feasible from a societal perspective.
Recommendation: Validation of these calculations needed during the pilots
As this analysis shows a first calculation for the costs, benefit and effects of applying after-treatment on inland waterway vessel, the data should be validated during the activities in the PROMINENT project. The pilots will provide a valuable insight into not only the technical, but also the economic feasibility of applying after-treatment. In the pilots also the operational profile of the different vessel types and during the different journeys will be validated. The pilots and the validation among suppliers, end-users and other experts will be the basis of updating these data for the ex-post cost benefit analysis, which will be performed in WP6.Possible fuel reduction by fuel optimisation of CCNR Stage-II engines
One potential benefit is not taken into consideration in this analysis, which is the possibility to improve the fuel consumption and PM emissions of a CCNR Stage-II and EU NRMM Stage III-a approved engines by allowing higher engine out NOx emissions. This is referred to as NOx-BSFC and NOx-PM trade-offs. The urea consumption for the CCNR II engine will usually increase up to the level of a CCNR I engine. But the fuel consumption reduction can be more or less equal to the urea consumption. This could mean a substantial annual benefit. However, this cannot be done without obstacles, as the engine setting then needs to be changed and the original type approval is not valid any more.Focus on the stimulation of environmental benefits in the policy recommendations
As this ex-ante cost effectiveness analysis shows that there is currently not yet a positive business case for the application of after-treatment, and that for assessing the effectiveness in reducing NOx and PM emissions, it is important to also take the external cost reduction into account. It will be an interesting focal point for the policy recommendations, if there is a possibility to monetise this environmental benefit of the application of SCR and SCR+DPF. One of the options is a discount on the port dues, which is already provided in some of the ports and included in this analysis under the representative journeys in the Rhine/ARA region.The full analysis can be found under downloads
Development of Standardised Components for Best Available LNG Technologies; LNG Fuel Tank Containers and Non-Containerised Tanks
This report covers the study to the development of standardized components for best available LNG technologies, and specifically the LNG fuel tank containers and non-containerised tanks. The corresponding sub-activity LNG fuel tank containers and non-containerised tanks prescribes a study to:
– Non-containerised fuel tanks
– Technical compatibility with other systems
– Fuel tank containersTechnically the first step was to define a the standard which could work for the transport, the storage as well as a fuel tank for inland waterways transport (IWT) vessels. The standard specifications for LNG fuel containers would be the best and economically the most interesting option for Trifleet to use where it is able to reach the goal to supply tanks with at least 10% cost saving compared with the tanks used on the current vessels.
For technical issues it is necessary to find a manufacturer who was not only able to do the engineering, but also was able to perform the whole approval process. Many manufacturers did offer a solution, but in the end none of them could provide the approval documents.
Gascon South Africa has worked together with Bureau Veritas Marine and Offshore towards a design where tank containers could receive an approval for the use as fuel tanks on board inland waterway vessels. This design differs from the standard design by Trifleet since a bottom discharge was not possible without introducing the issue with the double walled piping. For this reason a top discharge was introduced. For the discharge an additional pumping/pressure system to empty the tank is necessary. With the additional system and the corresponding controls, the tank container is commercially less interesting.
Furthermore the requirements regarding the materials of each component of the tank container would need to meet higher standards and certifications. Due to this, each material and each part would need to be tested and investigated and inspected by an independent authority. This will introduce many extra cost to the material, making it more expansive than the regular transport tank.
The requirements regarding the calculations of the dynamic loads on the tank are different as those from a standard transport tank. With a standard transport tank it is enough to take, for example Fatigue calculations into account based on the loads acting on the tank during transport by Rail road and sea. In general the rail traffic is the worst case regarding the fatigue loads. According to the ISO rules and the CSC rules transport tanks need to be impact approved. Similar calculations are asked with the type C tanks but then the manufacturer need to show those calculations for each different ship, and even locations on the ship making a standard more or less impossible.
In practice it means that for each ship the fuel tank needs to be approved separately making a standard impossible. And again, even when a standard UN Portable tank will pass those calculations, the fact that it needs to be done with each new ship makes it less interesting. Engineering cost on a ship are proved to be the highest cost.
Based on the previous results and necessary additions to the tank containers, Trifleet decided to stop the research towards an approved certified standard fuel tank. The conclusion is that under the current circumstances a standard like described, is not feasible and type approval is not possible.
The full analysis can be found under downloads
Execution of Ex-Ante Cost/Benefit Analysis for The Best Available LNG Technologies for Vessels
This analysis addresses the ex-ante costs and benefits for the best available LNG technologies individually and together in different configurations. The potential savings on fuel costs, resulting from the switch of diesel to LNG, forms the core of the financial benefits in this analysis. The fuel cost savings, and also the business case, strongly depend on the LNG fuel price on the one hand, an external factor from the ship owners point of perspective, and the fuel consumption of the relevant vessel on the other hand.
Benefits for the society in the form of environmental benefits due to emission reduction are significant and may in some cases reach nearly a half million euros annually achieved by one vessel. Most benefits are made on reducing NOx, whereas benefits rising from CO2 reduction are relatively marginal.
The total cost is defined for six different LNG configurations for inland vessels and it appeared that costs strongly vary among the different configurations and representative vessel types, depending on factors like whether it concerns an existing vessel or newbuild, place of the LNG tank, the installed power on board, LNG engine type, etc. Vessels with relatively high investment costs also benefit on average the most from lower fuel costs resulting from the switch to LNG,
while it appeared that higher investment costs can mainly be related to a higher installed power and the requirement for more engines but this means at the same time a relatively higher fuel consumption on average and consequently higher savings on fuel costs.The business case strongly depends on the investment costs, the fuel price and the fuel consumption. Given the investment costs and fuel savings it is possible to realise a positive business case, without any subsidy, during the economic lifetime of the LNG-installation of 10 years.
The full analysis can be found under downloads
Digital Inland Waterway Area
Study on support measures for the implementation of the TEN-T core network related to sea ports, inland ports and inland waterway transport.This report is the result of a study on the future digitalization of inland waterway transport. Digitalization is affecting many sectors and industries. In transport and logistics the use of digital technologies is essential to streamline business processes between shippers and logistics actors. Several modes of transport have adopted different kinds of intelligent transport systems and are investigating the possibility of using (semi-)autonomous vehicles. Rapid technological developments have reduced the implementation barriers for such approaches. Public authorities are responded by providing the necessary regulatory frameworks and through specific digitalization initiatives. In a European context this includes the Digital Single Market initiative and the Digital Transport & Logistics Forum.
Study on the use of ethyl and methyl alcohol as alternative fuels in shipping
Summary of report
Introduction
Methyl and ethyl alcohol fuels, also referred to as methanol and ethanol, are good potential alternatives for reducing both the emissions and carbon footprint of ship operations. As they are sulphur-free, use of methanol and ethanol fuels would ensure compliance with the European Commission Sulphur Directive. The European Maritime Safety Agency (EMSA) commissioned this study to gain more information about the benefits and challenges associated with these fuels and to evaluate their potential for the shipping industry.
Previous and current projects
Methanol has been investigated as a marine fuel in a few past research projects, two of which involved pilot test installations on ships. The Swedish EffShip project identified methanol as a promising marine fuel after studying alternatives and carrying out laboratory testing on a diesel concept engine. This led to further testing and development within the SPIRETH project, which led to the world’s first methanol conversion of main engines on a passenger ferry, the Stena Germanica, in 2015. Waterfront Shipping has commissioned seven new chemical tankers with dual fuel methanol engines to be delivered in 2016. New research projects underway or recently started include a German Project, Methaship, to develop designs of methanol passenger vessels, and the EU Horizon 2020 project LeanShips, which includes a work package to test a marine methanol engine in a laboratory. These new projects demonstrate the growing interest and potential of methanol as a marine fuel. No projects have been identified for ethanol on ships, but it has been used in diesel engines in road transport for many years.
Properties, safety and regulations
Methanol and ethanol are both colourless, flammable liquids. Methanol is the simplest of alcohols and is widely used in the chemical industry. It can be produced from many different feedstocks, both fossil and renewable, with the majority produced from natural gas. Renewable methanol is produced from pulp mill residue in Sweden, waste in Canada, and from CO2 emissions at a small commercial plant in Iceland. Ethanol is also an alcohol and is mainly produced from biomass, with the majority on the world market produced from corn and sugar cane. Both methanol and ethanol have about half of the energy density of conventional fossil fuels, which means that more fuel storage space will be required on board a vessel as compared to conventional fuels. They can also be corrosive to some materials, so materials selection for tank coatings, piping, seals and other components must consider compatibility. Methanol is classed as toxic so requires additional considerations during use to limit inhalation exposure and skin contact. Ethanol is not classified as toxic to humans.
The flashpoints of methanol and ethanol are both below the minimum flashpoint for marine fuels specified in the International Maritime Organizations (IMO) Safety of Life at Sea Convention (SOLAS). This means that a risk assessment or evaluation must be carried out for each case demonstrating fire safety equivalent to conventional fuels for marine use. Guidelines are currently in draft for the use of methanol and ethanol fuels on ships, for future incorporation in the newly adopted International Code of Safety for Ships Using Gases or Other Low-Flashpoint Fuels (IGF Code). This will facilitate the use of these fuels on board ships. The previously described Stena Germanica and Waterfront Shipping chemical tanker projects both carried out risk assessments and were approved for installation, demonstrating that safety considerations are not a barrier to the use of methanol fuel systems on ships.
Availability
Methanol is widely available as it is used extensively in the chemical industry. There are large bulk storage terminals in both Rotterdam and Antwerp, and it is transported both with short sea shipping and by inland waterways to customers. Ethanol is the most widely used biofuel in land based transportation and can be found at most large chemical storage hubs in Europe.
Environmental impacts
Methanol and ethanol both have many advantages regarding environment impacts as compared to conventional fuels – they are clean-burning, contain no sulphur, and can be produced from renewable feedstocks. Emissions of both methanol and ethanol from combustion in diesel engines are low compared to conventional fuel oils with no aftertreatment. Particulate emissions are very low, and nitrogen oxide emissions are also lower than with conventional fuels, although the amounts depend on the combustion concept and temperature. If a pilot fuel ignition concept is used with methanol and ethanol there will be a very small amount of sulphur oxide emissions which will depend on the amount and sulphur content of the pilot fuel.
The environmental impact of production and use of methanol “well to wake”, using greenhouse gas equivalents as an indicator of global warming potential, varies according to the feedstock. Methanol produced using natural gas as a feedstock has “well to tank” emissions similar to other fossil fuels such as LNG and MDO. Bio-methanol produced from second generation biomass such as waste wood has a much lower global warming potential than fossil fuels and is lower than ethanol by most production methods. “Well to wake” emissions from ethanol are lower than fossil fuels but the amount varies with production methods and feedstock. For example the ethanol produced in Brazil and in Sweden has much lower “well to tank” greenhouse gas emissions than that produced from corn in the US.
The behaviour of methanol and ethanol fuels when spilled to the aquatic environment is also important from an environmental performance perspective as ship accidents such as collisions, groundings and foundering may result in fuel and cargo spills. Both methanol and ethanol dissolve readily in water, are biodegradable, and do not bioaccumulate. They are not rated as toxic to aquatic organisms.
Cost and economic analysis
Prior to the recent oil price crash, methanol prices were below the price of low sulphur marine gas oil (MGO) on an energy basis for two years from 2011 to 2013, making it an attractive sulphur compliance option. With the low oil prices in 2014 and early 2015, methanol was comparatively more expensive but in late 2015 the price of methanol has started to move closer to the levels of MGO again. Cheap natural gas, a primary feedstock for producing methanol, contributes to lower production costs and thus methanol may be economically attractive again compared to conventional fuel alternatives. Ethanol prices have been higher than MGO traditionally, similar to other types of biofuels. Fuels from non-fossil feedstock, including bio-methanol, tend to have a higher price than fossil fuels.
Investment costs for both methanol and ethanol retrofit and new build solutions are estimated to be in the same range as costs for installing exhaust gas after treatment (scrubber and SCR) for use with heavy fuel oil, and below the costs of investments for LNG solutions. Operating costs are primarily fuel costs. The payback time analysis carried out for this study indicate that methanol is competitive with other fuels and emissions compliance strategies, but this depends on the fuel price differentials. Based on historic price differentials, methanol will have shorter payback times than both LNG and ethanol solutions for meeting sulphur emission control area requirements. With the current low oil prices at the end of 2015, the conventional fuel oil alternatives have shorter payback times.
Disclaimer: The content of this report represents the views of the authors only and should not be taken as indicative of the official view of the European Maritime Safety Agency (EMSA), or of any other EU institution or Member State. EMSA, SSPA and Lloyd’s Register assume no responsibility and shall not be liable to any person for any loss, damage or expense caused by reliance on the information or advice in this document.
Emergency and incident response study – LNG in inland shipping
The aim of the study is to explore the existing knowledge regarding the transportation of LNG and the use of LNG powered vessels on the waterways as well as to determine the possible scenarios involving an LNG leak that an incident response team could face.
Incident response is defined as the response required by local authorities, such as fire brigade, police, ambulance and harbour/river authorities, to deal with situations which have escalated outside the capability of initial responders, such as the ship’s crew, operators etc.
The information gained as a result of the study will be used to increase awareness in handling such incidents, make recommendations concerning the resources required for a response and provide guidelines for the training required for incident response.
The study provides an overall picture outlining the incidents that could emerge in dealing with LNG in inland navigation and how to respond to them. The study focuses on:- Development of spill, emission and escalation scenarios for small scale LNG activities
- Development of incident response scenarios for small scale LNG
- Development of guidelines for incident preparedness
- Development of guidelines for education and training on incident response LNG
- Knowledge dissemination and emergency advice
Much is already known regarding LNG specifically in shipping; however, that is relevant to sea-going transportation on a bulk scale – the emphasis of this study is “small scale”, which is reflected in the reduced quantities and limitations of inland shipping.